blockr
blockr.RmdGet started
blockr provides plug and play blocks which can be used to import, transform and visualize data. This guide provides an entry point for end users without extensive coding skills, as well as developers.
{blockr} for non coders
In that case, you likely just want to get started to create your first data pipeline.
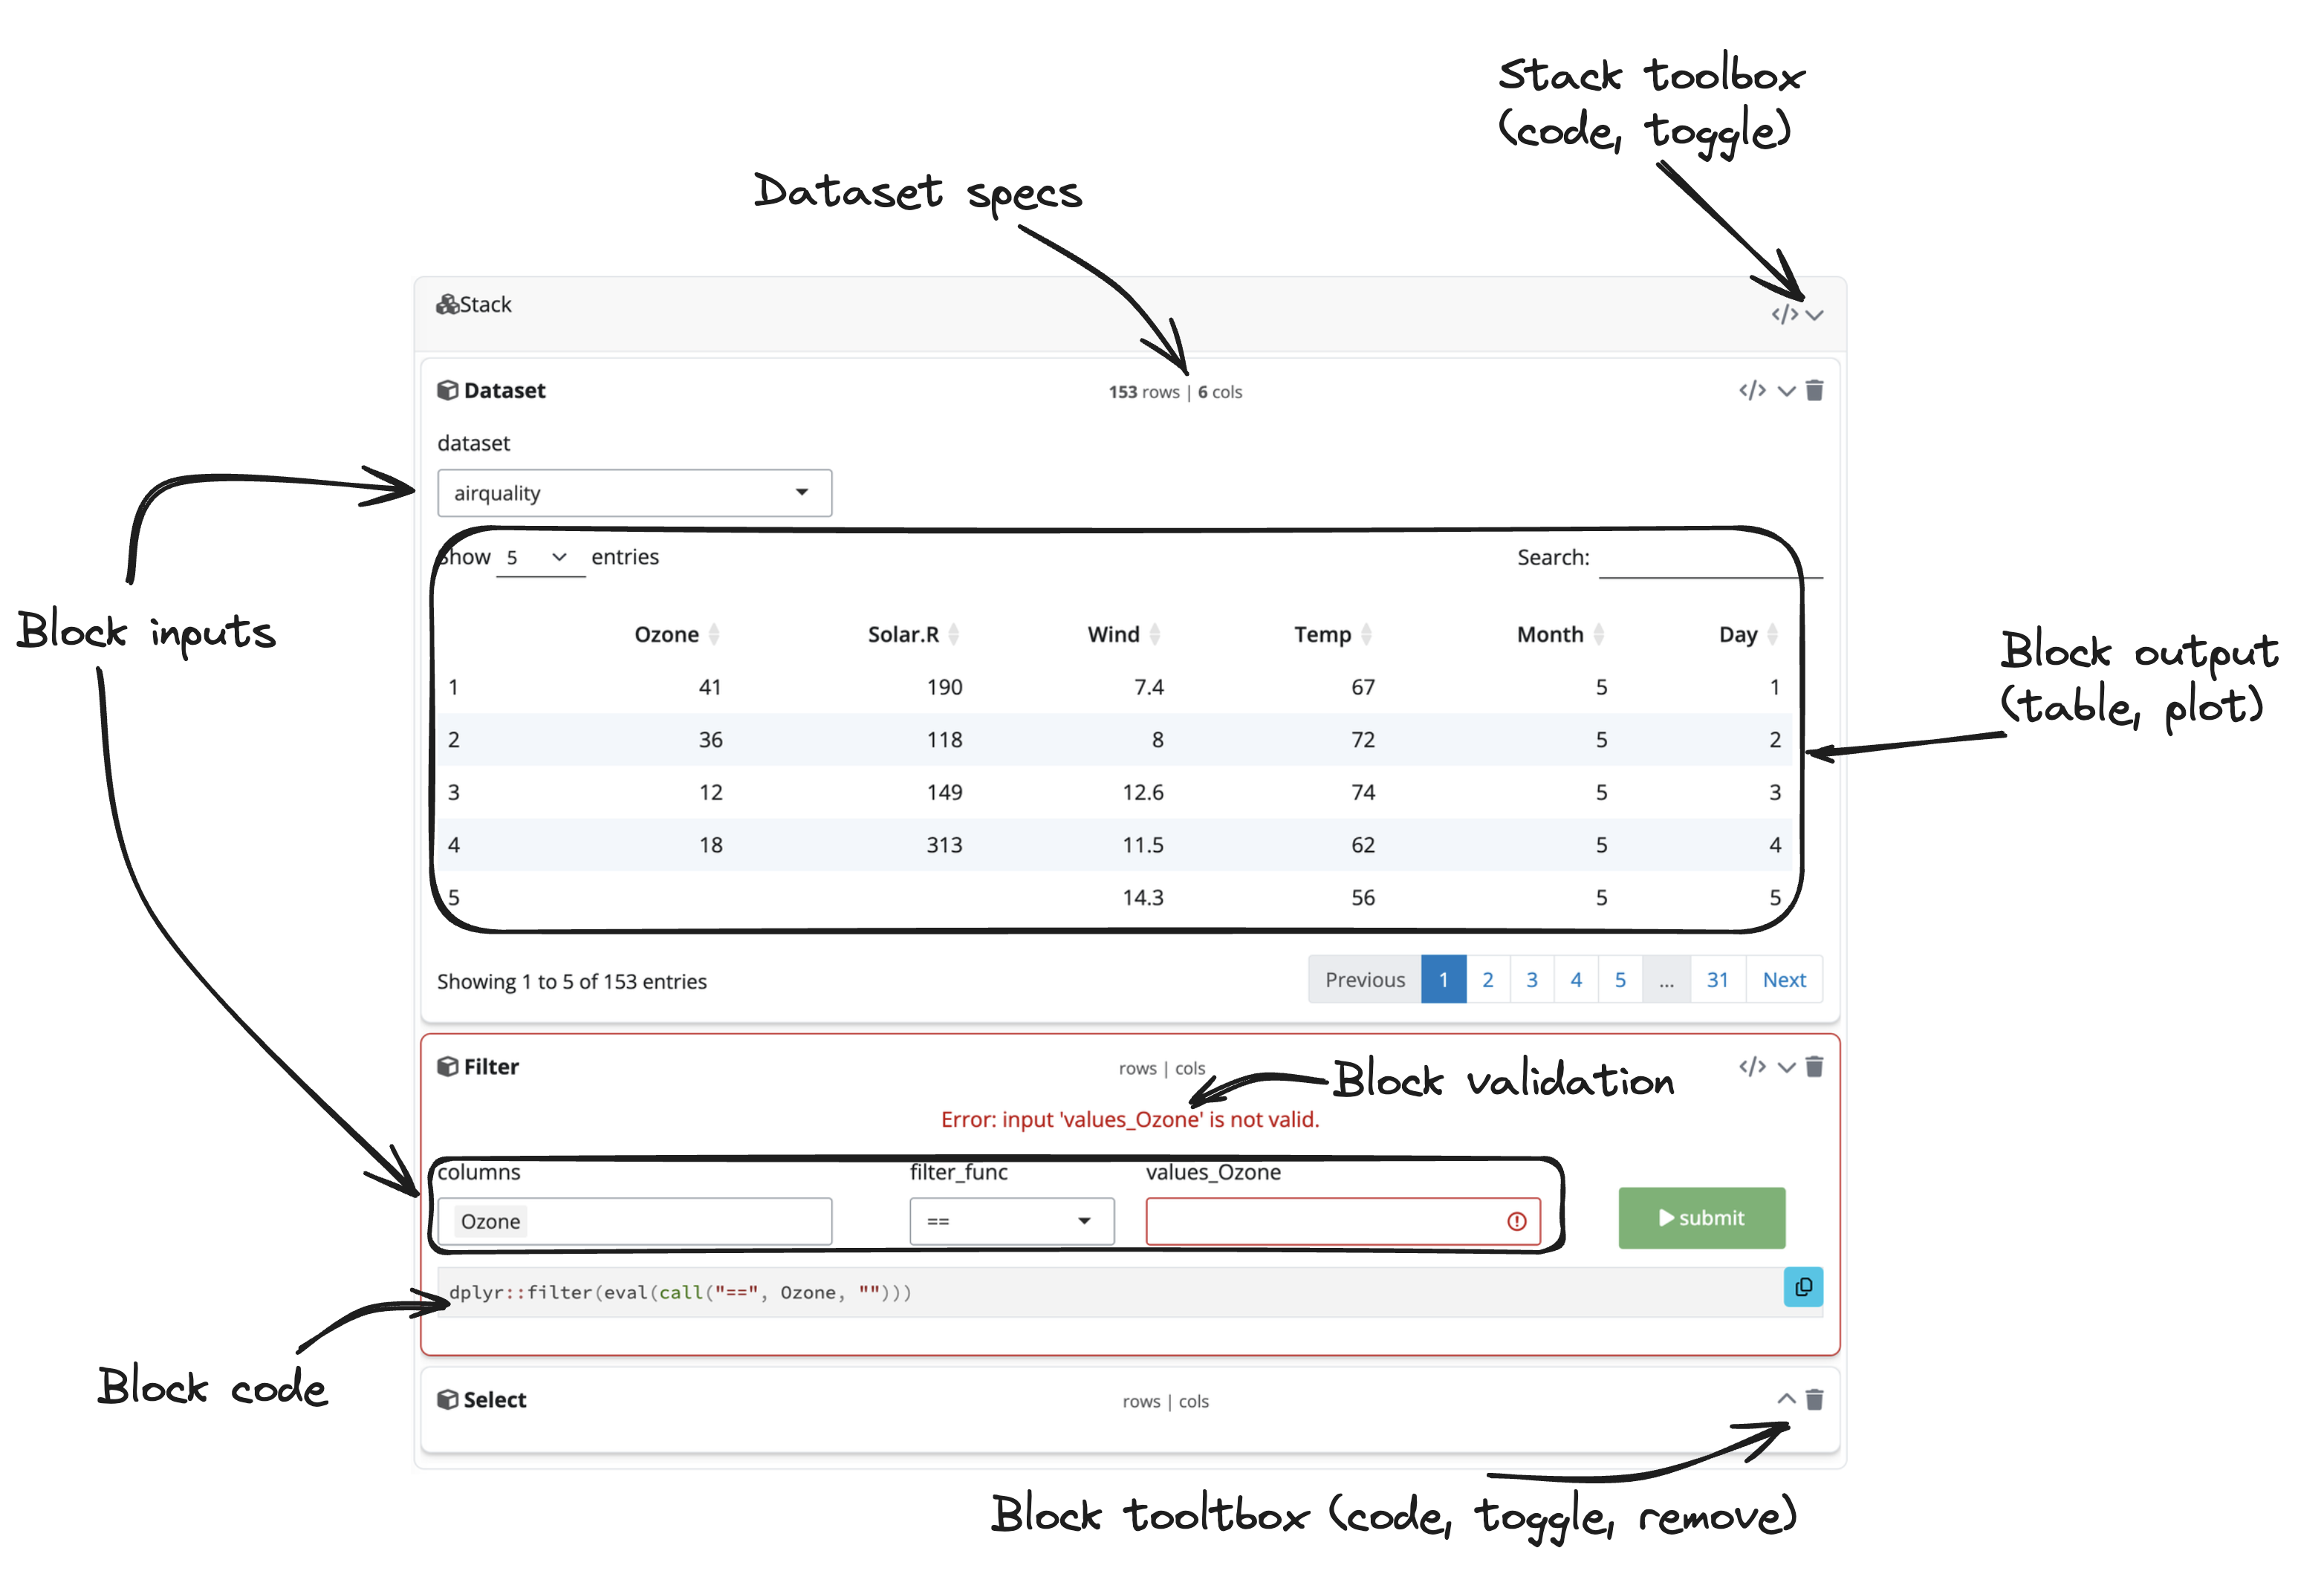
The user interface
This is what the blockr interface looks. We designed
it to be like a cooking recipie, where blocks
correspond to the different steps. Within each block
are some inputs that allow you to change parameters.
For instance, when you import the data, you may want to select a given
dataset or specify a file from your computer or on a server. In figure
@ref(fig:blockr-ui), the airquality dataset is imported. On
the top center of the block, you can see information about the number of
rows and columns. Then, a filter block is added and target the
Ozone column. Notice the validation
message as the value is missing. The submit button can’t be clicked as
long as the input is empty, which prevents from triggering errors in
downstream blocks. Each block can be collapsed/uncollapsed and removed
with the corresponding buttons located on the top right corner. As you
can see, we group all related blocks inside a common container, the
stack, which can also be collapse and removed.
User Interface Overview
Starting from scratch
When you start from scratch, there are actually no blocks in the
interface and you have to add them one by one. To add a new block, you
can click on the + icon on the stack top right corner. This
opens a sidebar on the left side, where it is possible to search for
blocks. To make things easier, all the suggested blocks are compatible
with the current state of the pipeline. For instance, when the stack is
empty, only entry point blocks are suggested, so you can import data.
Then, after clicking on the block, the suggestion list changes so you
can, for instance, filter data or select only a subset of columns, and
more.
Toward a dashboard
What if you aim at creating a more ambitious pipeline? In that case, you don’t need one cooking recipie but multiple, so you can organise your own dinner party. Below is a slightly more complex application, where you can add multiple stacks and connect them together. This are the following step to connect 2 stacks together:
- Click on “Add stack”.
- Add a new dataset block with the default BOD dataset.
- Add a filter block. Target the Time column with values between 1 and 2, then click “submit”. You should get only 2 rows.
- Click on “Add stack”.
- Add a new result block in this second stack. You should see the same result as in the first stack.
Doing so, you can build you analysis step by step in a modular way.
{blockr} for developers
In the following section, we describe the building blocks behind blockr so you can start creating your blocks.
Introduction
blockr aims at abstracting the logic behind common data pipeline tasks under blocks, without requiring any programming background. Besides, blockr exposes multiple tools so that advanced developers can easily extend it. We assume that a stack is a succession of dependent blocks. We designed 3 kinds of blocks:
- data block: entry level block to determine input data.
- transform block: materialize dplyr operations on the selected data.
- output (only plot for now) block: consumes transformed data to produce visualizations.
A stack always starts from a data block and may end either by a transform blocks or an output block. This means that, at the moment, there can only be one output block per stack.
Under the hoods, blocks are composed of fields. The latter are translated into shiny inputs used to convey interactivity within the block. As you can see in the below diagram, fields are combined to compute an expression, which eventually leads to a block result after evaluation. For a data block, there is no data input.
For instance, if we assume a filter dplyr expression:
data |> filter(col1 == "test")This operation can be translated to
data |> filter(<COLNAME> <FILTER_FUNC> <FILTER_VALUE>, ...),
where <COLNAME>, <FILTER_FUNC> and
<FILTER_VALUE> are fields, to give
the end user the ability to change the expression. Note that fields may
have dependencies, <COLNAME> controling the number of
filters to apply. Besides, at the moment, our implementation of the
filter block exposes additive operations, meaning that the result
corresponds to cond1 && cond2 && ....
Create a stack
To create a stack, you call new_stack()
and feed it all the required blocks. Below is a simple
stack providing a dataset selector and a filter operation.
serve_stack() is a simple wrapper to run the corresponding
shiny app. Note that with serve_stack(), you don’t need to
worry about specifying any modules IDs, they are
automatically handled by blockr.
blocks can be instantiated either by calling their constructor name and passed to the stack:
stack <- new_stack(new_dataset_block)Alternatively, it is possible to create block with specific parameter values, as shown below:
library(blockr)
library(blockr.data)
library(palmerpenguins)

stack <- new_stack(
  block1 = new_dataset_block(selected = "penguins", package = "palmerpenguins"),
  block2 = new_filter_block(columns = "species", values = "Adelie")
)
serve_stack(stack)
By default, only the last stack block is visible,
all others are collapsed. To preview all block you can set
options("BLOCKR_DEV" = TRUE).
Example with modules
This might be useful if you consider embedding blockr in your own application. The stack can be nested within modules.
library(shiny)
library(blockr)

stack <- new_stack(
  new_dataset_block,
  new_filter_block,
  new_select_block
)

block_ui <- function(id) {
  ns <- NS(id)
  generate_ui(stack, id = ns("b"))
}

block_server <- function(id) {
  moduleServer(
    id,
    function(input, output, session){
      ns <- session$ns
      generate_server(stack, id = "b")
    }
  )
}

ui <- function(req) {
  fluidPage(
    theme = bslib::bs_theme(5L),
    div(
      class = "row",
      block_ui("x")
    )
  )
}
server <- function(input, output, session) {
  block_server("x")
}

shinyApp(ui, server)
Connect stacks: the workspace
The workspace allows you to create more complex analysis by connecting stacks together and get a dashboard. To know more about this you can read the following article.