Welcome to blockr
What is blockr?
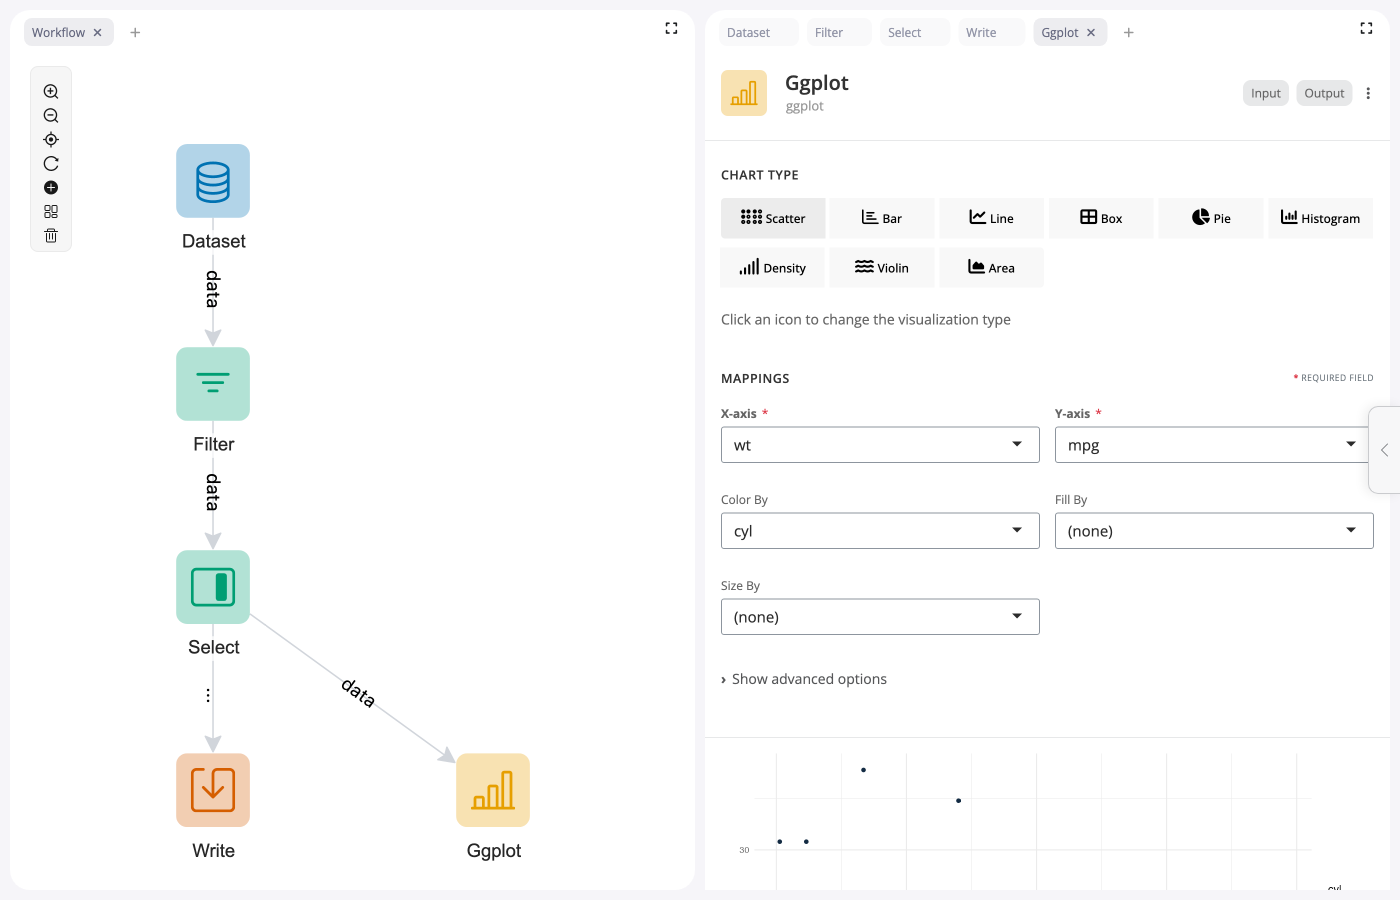
blockr is a visual framework for building data workflows. Instead of writing code, you work with blocks - each block performs a specific task like loading data, filtering rows, or creating a chart. Connect blocks together to build complete data pipelines.
Who is it for?
blockr is designed for anyone who works with data:
- Analysts who want to explore data without writing code
- Researchers who need reproducible workflows
- Teams who want to share and collaborate on data pipelines
How it works
- Add blocks to your workspace - choose from data import, transformation, visualization, and export blocks
- Connect blocks together to create a pipeline - data flows from one block to the next
- Configure blocks using dropdowns, checkboxes, and input fields - no coding required
- See results in real-time as you build - each block shows a preview of its output
Available blocks
blockr comes with blocks for common data tasks:
Import and Export
- Import Data - Load CSV, Excel, SPSS, SAS, Stata, Parquet files from your computer, a server, or URLs
- Export Data - Save results to CSV, Excel, or Parquet files
Data Transformation
- Filter Rows - Keep rows matching specific values
- Select Columns - Choose which columns to keep
- Calculate Columns - Create new columns using formulas
- Aggregate Data - Calculate totals, averages, counts
- Sort Rows - Order data by column values
- Lookup & Merge - Combine tables by matching columns
- And more: Rename, Pivot, Stack, Split…
Visualization
- ggplot - Create scatter plots, bar charts, line graphs, histograms, and more
- Theme - Customize colors and styling
- Facet - Split plots into panels
- Grid - Combine multiple plots
Next steps
- Install blockr locally:
vignette("install", package = "blockr"), if you want to run it on your own machine - Working with blockr:
vignette("blockr", package = "blockr")- a guided walkthrough of building a workflow
Core packages
blockr is built on six specialized packages:
Foundational:
- blockr.core - Framework and architecture
- blockr.dag - Workflow management
- blockr.dock - User interface components
Block packages:
- blockr.dplyr - Data transformation blocks
- blockr.ggplot - Visualization blocks
- blockr.io - File import and export blocks
Extending blockr
Additional block packages can be installed for specific domains. For example, blockr.ts adds blocks for time series analysis.